Ozobots on Ozoblockly

Agenda

  1. Join your grade level Google Classroom using the join code. We are combining classes. Links are in Google Classroom, but here as well.
  2. Learn the basics of using Ozoblockly
  3. Calibrate an Ozobot on the computer, which is a little different than doing it on paper.
  4. Learn how to “Flash Load” (or load the program) your Ozobot
  5. Try out Task 1 – Square Walk
  6. Try out Task 2 – Dance Lesson
  7. If there is extra time, try your own programming
  8. Fill out the Exit Slip survey

Keep this tab with these instructions open, then open Ozoblockly in a separate tab.

Use the Google Slides below to teach yourself about Ozoblockly and how to program Ozobots using the computer.

Pair Programming Video

Ozoblockly Intro Tutorial

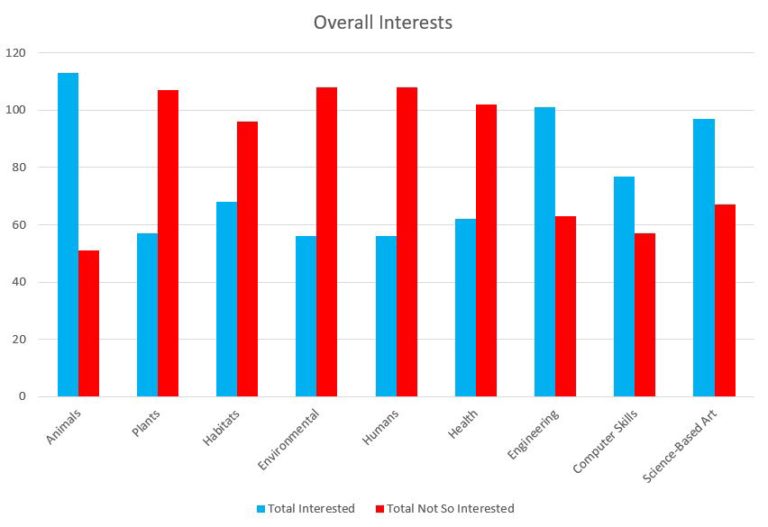
Survey Results

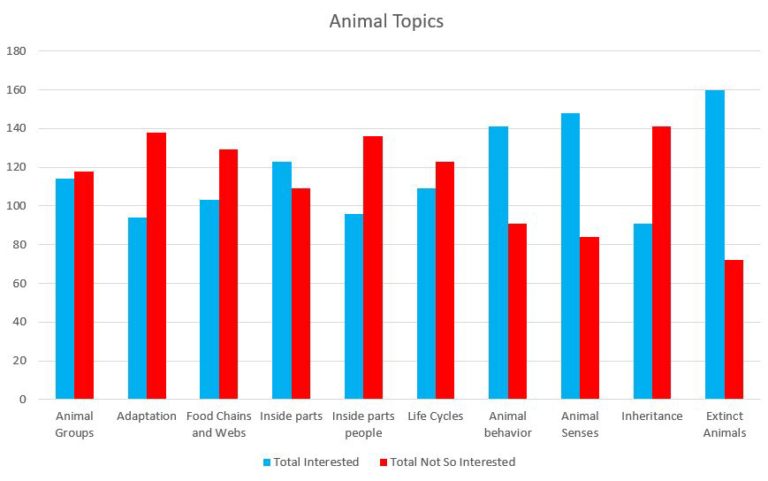
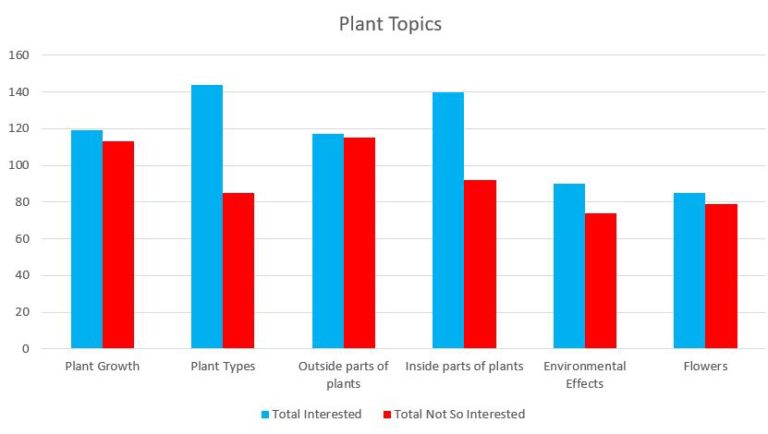
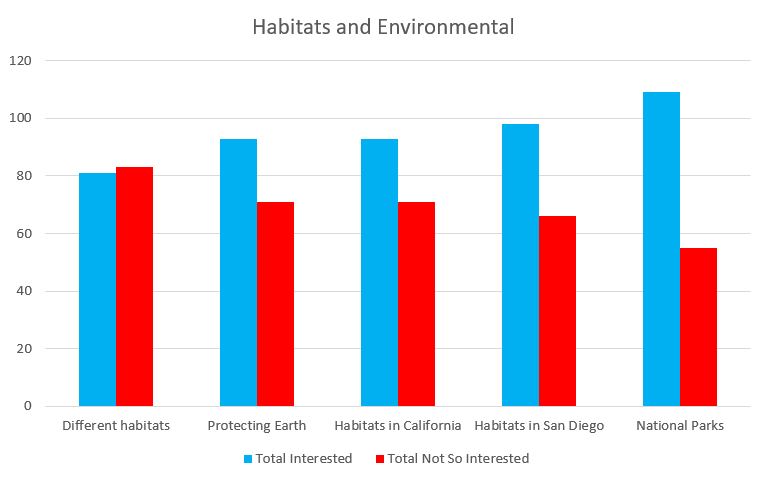
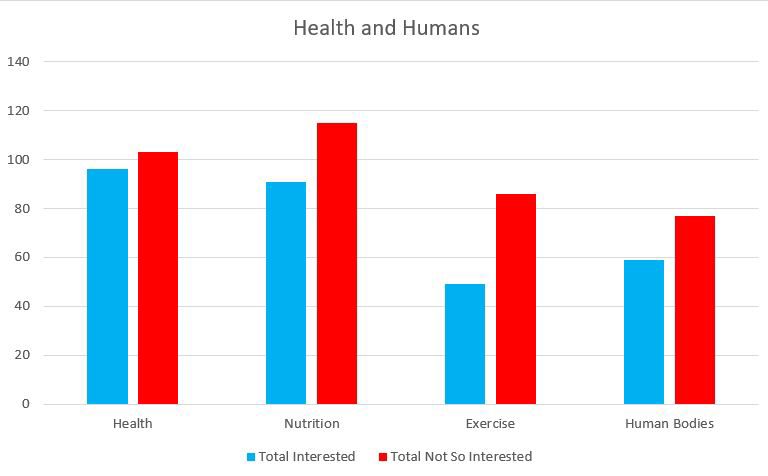
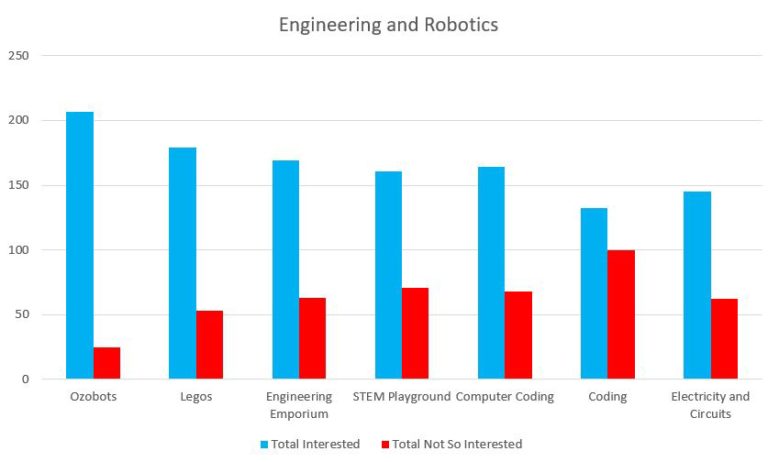
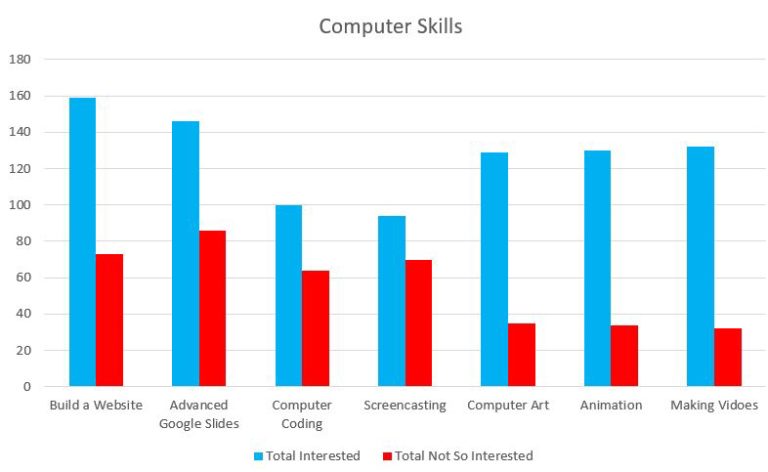
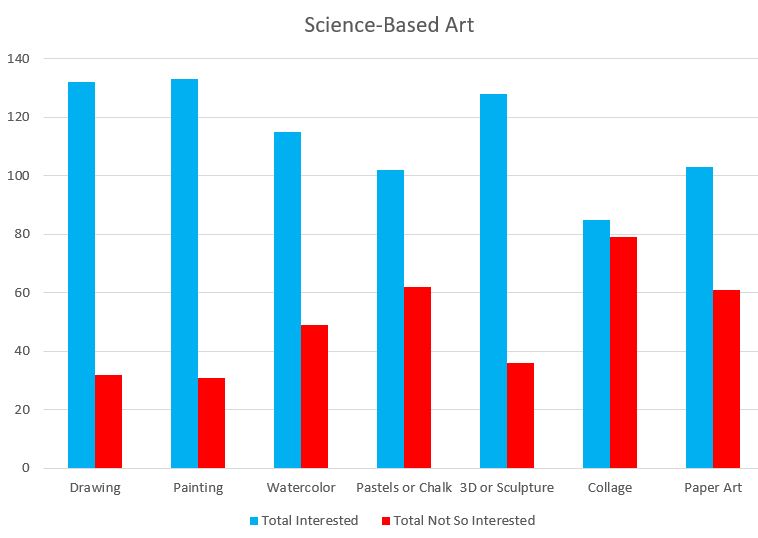
Here are the results from the Spring Science Interest Survey and the STEM Playground Survey. 

STEM Playground

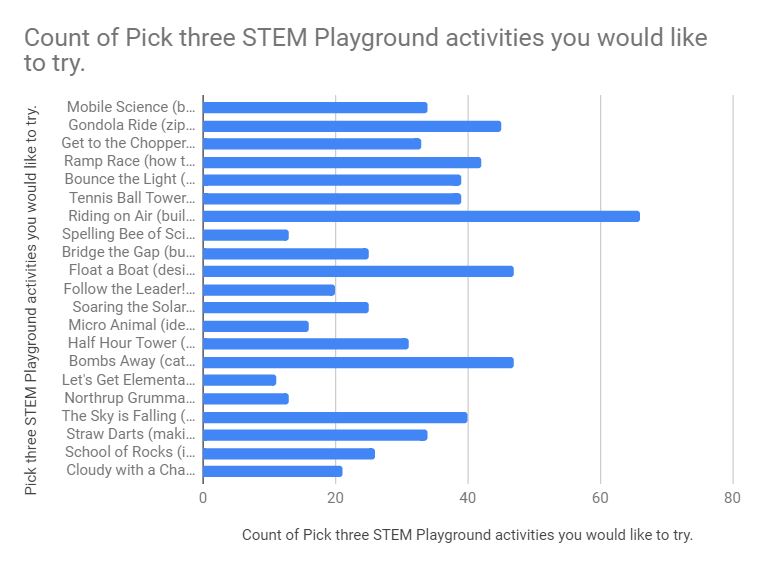
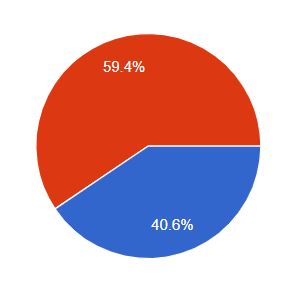
The overall results of 2nd-4th grade were to NOT to make the STEM Playground activities a competition. 

4th voted YES to make it a competition, 57% to 43%

2nd and 3rd (except for room 212) overwhelmed the 4th grade by voting overwhelmingly to not make it a competition. 

5th Grade and Mrs. Larkin’s class did not do the online survey. They voted by raise of hand. Those classes mostly voted for Bombs Away as their #1 choice.

The top five STEM Playground activities were: 

  1. Riding on Air
  2. Float a Boat
  3. Bombs Away
  4. Gondola Ride
  5. Ramp Race

Both Float a Boat and Bombs Away were tied.

Rooms 201, 203, and 212 did not take this survey, but when I asked about the activity they liked the most, Bombs Away was a favorite. (You can take the survey still. I posted it in Google Classroom.)

Science Interest Survey Results

First, I should explain that I changed the survey between when I gave it on Monday and then the rest of the week. It was hard to blend in the results from rooms 201, 203, and 212 with the rest of the classes. The results would be better if students from those rooms redid the new survey instead. I did put it in Google Classroom.

Continuing with Posters

Continue to work on your poster. Remember the answer you are trying to model is:

How does the inside structure of Earth affect the outside structure of Earth?

Work as a team to create a model that fully explains your answer. When you are done with your poster, your team will share it with the class.

During the sharing of posters, you will get a feedback form. While each group presents, you need to fill out the feedback form with the following information:

  1. Things they did well with their model/poster.
  2. Ideas for what they could improve in/with their model/poster.
  3. How clear was their explanation? Do you think they are correct? If not, what might be incorrect?
You may ask questions of the group after they present.
You will also give feedback for your own group at the end. This is when you can make comments about what/who worked well and who or what/who didn’t work well.

Continuing with our Oil and Thyme Question

Recap

Last time we explored links, interactives, and watched some videos to help with our scavenger hunt. We were looking for an answer to this question:

What does our oil and thyme experiment have to do with Earth’s structure?

Engage

This time, we will continue to explore for an answer to that question, but this time we have a new question that we will focus on:

How does the inside structure of the Earth affect the outside structure of the Earth.

Explore

You have 20-30 minutes to continue to explore the resources from last week (scroll down). While we still want to think about the oil and thyme demo, focus on finding evidence to help answer “How does the inside structure of the Earth affect the outside structure of the Earth.”

Explain

What did you find? You will work with your table partners to create a model on chart paper to explain your answer.

  • Work together as a team and talk about how to create the model before starting.
  • Use a pencil first before marker.
  • Use crayon for big areas of coloring.
  • Make sure everyone feels like they are a part of the poster. 
  • You may continue to use your computer as a resource while you work on your poster.

NGSS Standards

Science & Engineering Practices

  • I can develop and use a model to show my thinking and understanding.
  • I can analyze and interpret data and use it to show evidence.
  • I can gather data and communicate it to others.

Disciplinary Core Idea

  • Some Earth events happen slowly, while others happen quickly.
  • Some events happen over long time periods that cannot be observed in one life time.
  • Patterns of rocks and Earth formations happen because of the dynamics of Earth.
  • Tectonic activity shapes our planet.
  • Compare Earth to other objects in our solar system and space. 

Crosscutting Concepts

  • Structure and function
  • Cause and effect
  • Systems
  • Patterns

These are loose references to the DCIs for use in this enrichment classroom. They are a combination of standards in The History of Planet Earth across several grade levels.

SCROLL DOWN

The resources we are using today are the same from last week. See below or click the icon above to take you to that post.

Earth Dynamics

Remember our oil and thyme experiment. Let’s take a look at that again. Click on the video on the top left square.
What do you notice? What does it have to do with volcanoes and earthquakes?

Analyzing Data from Google Earth

1. Enable KML in Google Earth

For the last couple weeks we have been looking at volcanoes using maps or Google Earth. Since we have not had time to actually view all of the volcanoes at once, I will make it easier for you. 

  1. Open Google Earth web version.
  2. Go into Google Earth’s settings and “enable KML import” – toggle the button to blue. (click the three bars at the top left and then “settings,” then scroll to the bottom)  Short video shows how to do this.

2. Import Volcano KML

  1. Return to this page and download this file. The file will be in your folder.
  2. Go back to Google Earth and into “Bookmarks.”
  3. You will see “Import KML File” at the top. Click on this, then “from file” (not Google Drive).
  4. It will open the file explorer window. Go into your download folder and select “google-earth-volcanoes.kmz.”
  5. It will automatically load all of the volcanoes. 

3. Explore from a Distance

Now that you have all of the volcanoes loaded into Google Earth, take a look at the volcanoes from a distance – don’t zoom in too close. Move Earth around so that you can see all of them. What do you notice? What do you wonder?

Question: Why do volcanoes occur in these locations?

Use a claim-evidence-reasoning statement to explain your thinking. Here is an example, but also see the hints below.

Sentence frame: Volcanoes _______ [claim]. This is because ________[evidence]. This might be because ________ [reasoning].

Claim

A claim directly answers the question.

Use key words provided by the question or prompt as you write your answer.

Avoid using phrases like “I think” or “I believe.” Be CONFIDENT in your claim!

  • Volcanoes occur ___________.
  • ___________ happened when _________ 
  • I observed ________ when _________. 
  • I compared ________ and __________. 
  • I noticed __________, when _________. 
  • The effect of __________ on ___________ is _________

Evidence

Provide reliable data, clues, or information to support your claim.

What is your proof?

What do you observe that proves your claim?

  • In the image/map/Google Earth ____
  • One piece of evidence includes ___
  • In the data _____ 
  • The evidence I use to support ______ is _____ 
  • I believe _____ because _______. 
  • I know that ____ is _____ because ______ 
  • Based on _____, I think _______. 
  • Based upon ______, my hypothesis is ______.

Reasoning

Explain in detail how your evidence supports your claim.

Restate your claim and evidence to show your conclusion – your reasons for your thinking.

  • Based on this evidence, volcanoes _____
  • The reason I believe ______ is _________.
  • All of this proves that _____ because ______.
  • Based on the evidence, we can conclude
    _____ because ______.
  • From this evidence, the conclusion we can
    make is ____because _____.
  • These facts work together to build a case
    that _____ because ______.

4. Adding in Earthquakes

Now we are going to add Earthquakes to Google Earth. We can do this the same way that we added the volcanoes from above. 

  1. First you need the USGS kml file. You can download it here
  2. Upload it the same way you did the volcano list – “Import KML File” and then “Open File.”
  3. Find the file in your download folder – it is called 2.5_month_age_animated_link.kml.
  4. What claim-evidence-reasoning statement can you make from observing the Earthquake data? How does it connect to volcanoes? Earthquakes and volcanoes _________ [claim]. This is because _______ [evidence]. This occurs because __________ [reasoning].

5. Oil Observation

Last week we made an observation of oil and thyme over a heat source. Your assignment was to draw a model before and after the candle was lit.

  1. What pattern did you observe?
  2. How is this connected to volcanoes and/or earthquakes?

The Mantle and Crust

Previous Lesson

Last week we worked on mapping out volcanoes. I know that Google Earth did not work for most students, so, today, we will revisit that. You can return to that post here

Part 1

By now you should have created a model of Earth’s layers in your science notebook. 

The layers should be labeled.

Just want to check that we have completed this in our science notebook.

Part 2 - Making a Model

A model is an explanation of what we observe, discover, and learn – usually through drawing. 

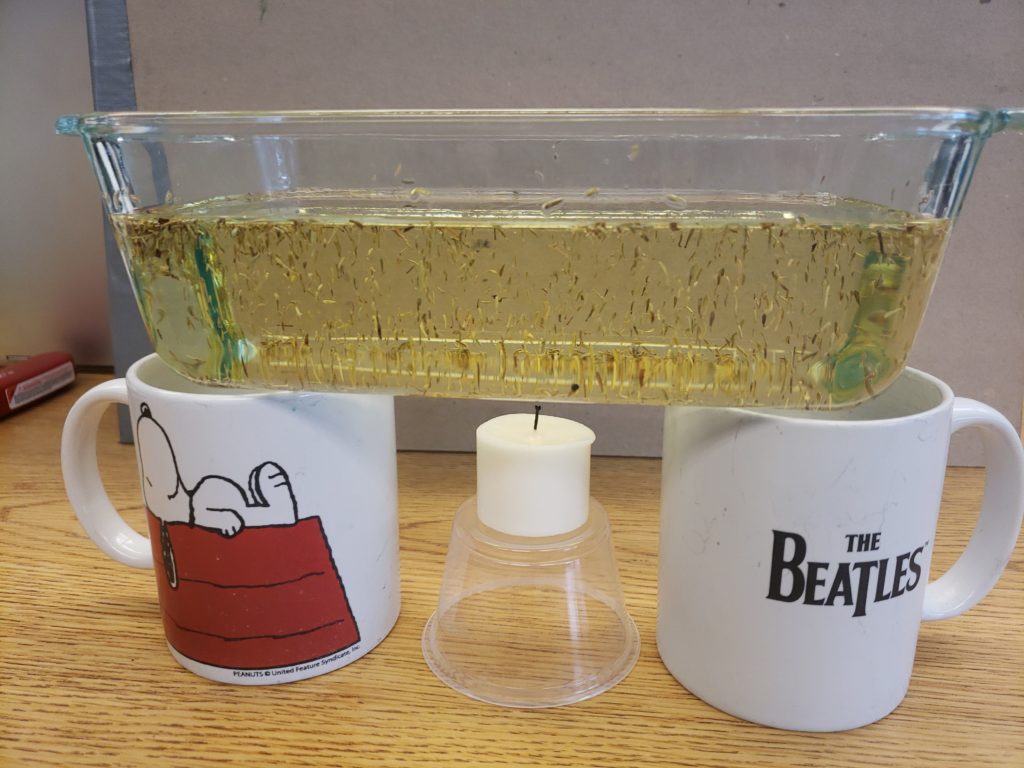
Draw a model of the set up we have on the table. 

We will uses this procedural vocabulary:

  • Container
  • Heat source
  • Supports
  • Oil
  • Thyme


We are going to observe the contents of the container without heat first. Then we will add heat and make a second observation. 

You will make a model in your science notebook to show what is happening in the demonstration. 

Remember a model shows the visible AND the invisible.

  1. What do you notice? 
  2. What are you wondering?
  3. How is this related to our Earth layers model?

Plotting in Google Earth

1. Earth's Layers

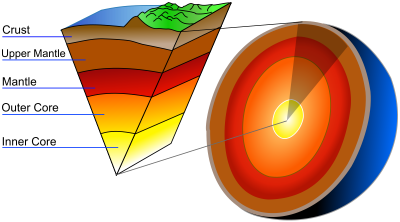
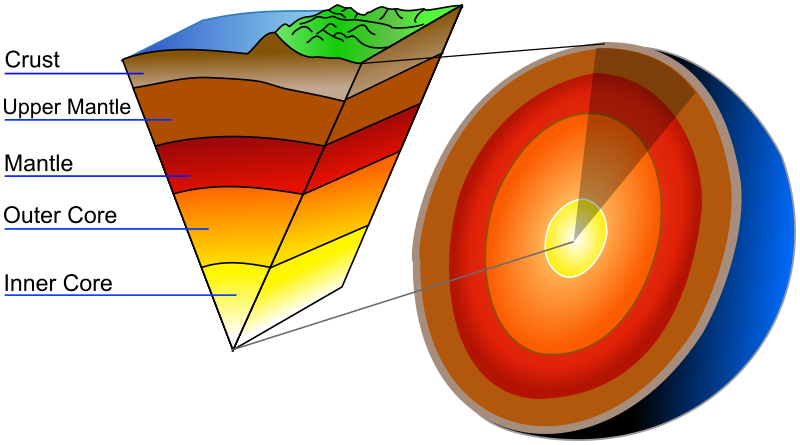
Last week we made a clay model of Earth’s layers. In your science notebook, draw a model on one page to represent the layers we learned about last week -BUT we are going to split the mantle into two – lower mantle and upper mantle. See the graphic below.

  • Inner Core
  • Outer Core
  • Lower Mantle
  • Upper Mantle
  • Crust

We will add more to this model later.

2. Loading Volcanoes in Google Earth

Before we work in Google Earth, we need to change a setting. You need to be logged in to your Google account in order to use Google Earth and save your bookmarks.

Watch this tutorial on how to do the set up and to also add bookmark locations. 

You will need Google Earth and the Volcano List.

Text instructions are below.

If you don’t want to follow the video directions. Here are the directions to read.

  1. Open Google Earth
  2. Go into the 3 bars and check that you are logged in.
  3. Scroll down to settings and click.
  4. In the settings window, scroll all the way down to the bottom. 
  5. Turn on the KML – “Enable KML file import” – the button should be blue.

  1. Keep Google Earth open.
  2. Open the Volcano List. This will open in a new tab.
  3. Copy the name of one of the volcanoes by highlighting the name and clicking on control C (or right click and copy).
  4. Click on the tab for Google Earth. 
  5. Find the search/magnifying glass.
  6. Paste the volcano name into the search field by using control V (or right click and paste).
  7. Click the magnifying glass or hit return.
  8. The map will fly in to that location.
  9. A picture will pop up that will have the bookmark symbol in the bottom left corner. Click that to save the location.
  10. Go back to the volcano list and copy another name, and repeat.
  11. Finish entering all the volcanoes – there are quite a few!!

Questions for Your Science Notebook

After you have added all of the volcanoes, answer these questions in your science notebook.

  1. When you look at the volcano locations, do you see any patterns? Describe the pattern.
  2. If a new volcano were to form suddenly on Earth, what type of location would you expect it to pop up?
  3. What do you think causes this pattern?

3. Adding Earthquakes using a KML File


Next we are going to enter earthquakes into our Google Earth map. This time, I will give you a short cut, and you won’t have to enter them separately. 

Follow the instructions in the video to add the KML file. You need to download it by clicking the link.

If you did not get your volcanoes all loaded, here is a short cut. Click here to download the volcano KML file

Text instructions are below.

If you don’t want to follow the video directions. Here are the directions to read.

  1. Click here to download the KML file
  2. Open Google Earth
  3. Go into the bookmarks from the side menu in Google Earth. 
  4. Click on “Import KML File.” This will be above the bookmarks. If you see the word “Done” instead, click on that first, then the import option will show up.
  5. Click on upload file.
  6. Find the 2.5_month_age_animated_link.kml file in your downloads folder.
  7. Click on the file, then open.

Questions for Your Science Notebook

After you have added all of the earthquakes, answer these questions in your science notebook.

  1. What patterns do you see with the locations of most earthquakes?
  2. How does this pattern compare with the pattern of volcanoes?
  3. What do you think is causing these patterns to occur?